LPAM Risk Factor: Green
As a young man growing up and going to school in the middle of Iowa, I learned to appreciate the true power of mother nature and the irony of contrasts. On any given day, a gorgeous, warm and otherwise calm and sunny day in the great plains could give way to the pure violence and power of a severe thunderstorm. While the thunderstorm would steal the show from the day, it was often short lived, giving way to the dominant weather trend at hand, sunny skies.
Like spring storms on the plains of Iowa, the most violent spasms in the stock market can occur during otherwise healthy bull markets and spring out of nowhere. These spasms are scary and can lead to the most experienced of investors to react irrationally, responding to price action and fear versus allowing the data points that steer the medium to long term direction of the stock market to drive the asset allocation process of their client portfolios.
Bottom line: The violent move lower in the stock market that we have experienced over the past week appears to be like a spring thunderstorm: violent and scary, but ultimately short lived. Our risk indicators remain green and we are using the pullback to opportunistically purchase high quality growth companies at discounted prices.
Warren Buffet’s investment mentor, Benjamin Graham, once said, “in the short run, the market is a voting machine but in the long term, it is a weighing machine”. Taking the lead from Mr. Graham, The LPAM Tactical Investment Process, uses a series of reliable data indicators to weigh the “balance of evidence” in the market to determine the overall health of the stock market. Based on the balance of evidence, as measured by our tactical risk indicators, we act to reposition client portfolios more defensively if there are signs of deteriorating market health or use otherwise healthy market pullbacks as buying opportunities.
The ability and discipline to remain tactically patient is one of many aspects that separates our strategy from the competition. Equities have volatility in their DNA so its extremely important to have an investment process that can separate normal bouts of market misbehavior from something direr. For example, it should also be noted going back to 1928, Bespoke Investment Group calculated the average occurrence of market corrections of at least 10% to be a little more than once a year. In other words, these short bouts of uncertainty are a natural part of every bull market cycle. The key is distinguishing the price movements that are synonymous with a quick, violent but otherwise insignificant afternoon thunderstorm versus the opening act of a larger storm front often associated with recessions.
We make this distinction by tracking indicators across the economy, equity and credit markets that often deteriorate ahead of an approaching recession, acting as an earning warning signal for our clients. By focusing on the symptoms of a recession, we increase the likelihood that we can successfully reduce risk ahead of a bear market. So where do we stand today?
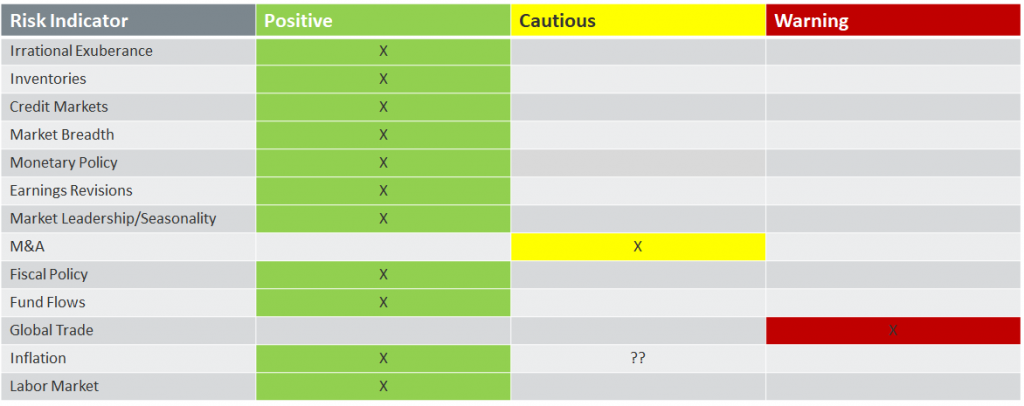
LPAM Risk Indicators are Green: The balance of evidence as things stand today remains favorable for stocks over the short to medium term.
While global trade flows are slowing thanks to an increase in tariffs, the negative impact of restrictive trade policy continues to be offset by the strengthening tailwind of US tax reform, strong labor markets, healthy credit markets, moderate inflation and rising wages accompanied by accommodative interest rates relative to the rate of US economic growth.
In fact, our work suggests that investors are underestimating the impact of tax reform. Unlike the 2004 tax repatriation holiday, which was a one-time deal, the “Tax Cuts and Jobs Act of 2017” is permanent, which makes the U.S. an attractive location to make long term, capital intensive investments relative to other countries. The impact has been clear; so far, the amount of capital that has made its way back to the U.S. in the first quarter of 2018 alone has surpassed $300 billion, far greater than the overall effect of the entire 2004 tax holiday.
Second, this cash is being put to work. The chart above and to the right shows the dramatic increase in capital spending forecasts for companies, before and after the passage of tax reform. In the manufacturing sector alone, capital investment plans have increased almost 400%.
From a quantitative perspective, the underlying plumbing of the market remains healthy with most stocks on the NYSE participating in the rally leading up to the pullback and with economically sensitive sectors outperforming recession proof stocks over the course of 2018. As recessions approach, the number of rising stocks tend to decline, even as the market continues to rise and recession proof stocks will begin to outperform their economically sensitive counterparts. This is not happening right now.
Bottom line: Strong stock market breadth and the relative outperformance of economically sensitive stocks has historically acted as a confirmatory indicator regarding the health of the stock market.
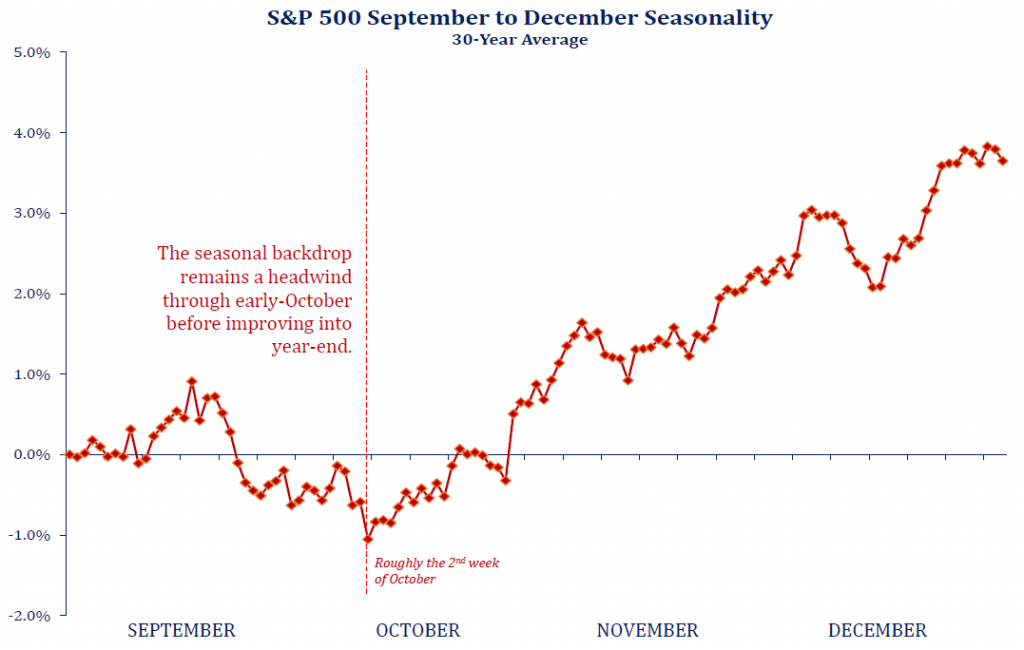
Additionally, beginning this week, seasonality will become a tailwind for stocks, with the second week of October historically marking the beginning of the Q4 run up for stock prices as illustrated by the chart below. Positive seasonality combined with the recent reset in stock prices make this a strong call to action for clients that were waiting for a good time to put money to work.
Regarding the longer-term outlook for stocks, the backdrop remains optimistic for the time being. Recessionary risks tend to initially metastasize in the bond market and/or global supply chains before spreading to the stock market. Fortunately, the corporate bond market and inventory supply chains are in stellar shape as we head into the seasonally strong holiday shopping season.
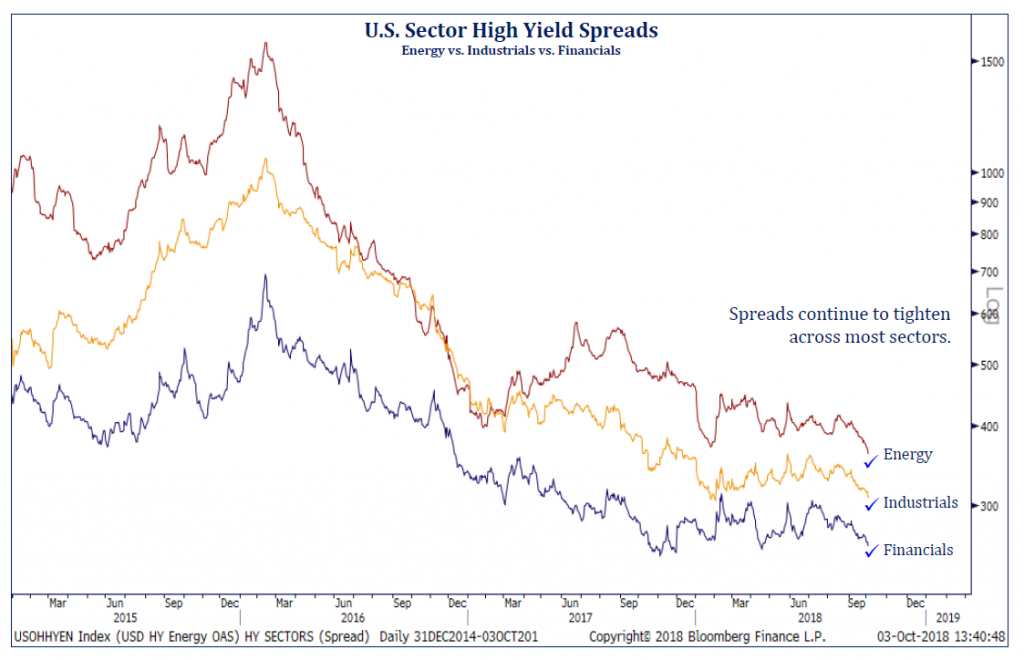
The chart below measures corporate credit risk in the U.S. as measured by how much it costs domestic companies to borrow money relative to the U.S. Government. Prior to recessions, these lines (spreads) tend to increase as bond investors see rising balance sheet risk from slowing business growth. As of this week, the cost to borrow money relative to the U.S. Government for U.S. companies continues to decline, which implies that bankers are not seeing rising credit risk amongst their corporate clientele and are extending credit at attractive rates. This type of behavior rarely takes place ahead of recessions.
Additionally, a demand-driven recession in the U.S. appears to be a below average risk, based on current data, as supply chains across the U.S. remain lean. In the real world, this means that it takes a low level of incremental demand growth to deplete merchandise on shelves, forcing companies to order more merchandise from their suppliers. Disciplined inventory management sustains healthy & predictable growth across the supply chain and reduces the chance of a supply/demand shock.
Demand-driven recessions are born from companies that lack disciplined supply chain management, become over confident, and order too much merchandise, only to be disappointed when sales come in below expectations. This results in destocking of inventories across the economy and causes upstream supply chain orders to be cut, causing economic growth to drop off, resulting in a traditional recession.
To measure this risk, we analyze the level of inventory growth across the U.S. supply chain relative to the level of new order growth. This measurement gives us a sense as to how rapidly new inventory growth is being offset by new orders, thereby keeping inventories lean and the prospect for future new order growth stable and upward, otherwise known as the inventory cycle.
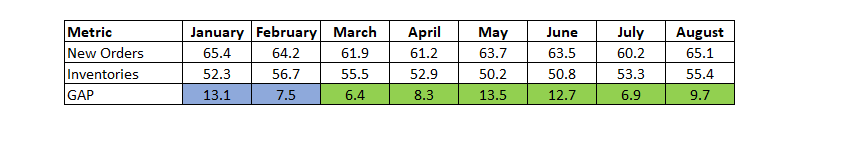
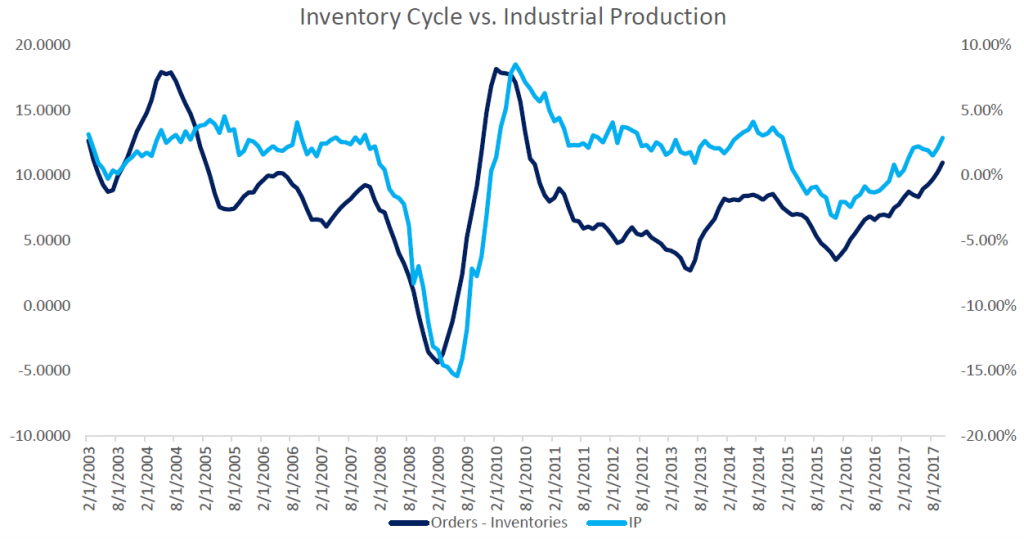
The charts above, are the results of our latest inventory cycle work, which suggest that new orders are growing much faster than the rate of inventory growth. When new orders grow faster than inventories, that tends to act as a leading indicator for industrial production, which itself, acts as a lead for the direction of corporate earnings.
Takeaway: With new orders growing strongly, the risk of an inventory correction appears below average, which is a positive leading indicator stocks in the short to medium term.
With strong new order growth across the economy, lean inventories and healthy balance sheets across the banks and corporate America, an overheating, inflationary economy becomes the main source of future risk to asset prices. Fortunately, our risk indicators are wide in scope and can monitor the economy for these signs and if necessary, reduce a client’s exposure to stocks when our indicators point to signs of overheating.
The main symptom of an overheating economy is rising inflation, more specifically, core inflation, which strips out the volatile price movements of energy and food. This allows us to identify the core factor fueling the direction of core inflation, which is wage growth. By tracking wage growth, not only can we track inflationary pressures before they rise to the surface, but we can analyze the historical impact of rising wages in an otherwise healthy economy and what it means for future stock returns.
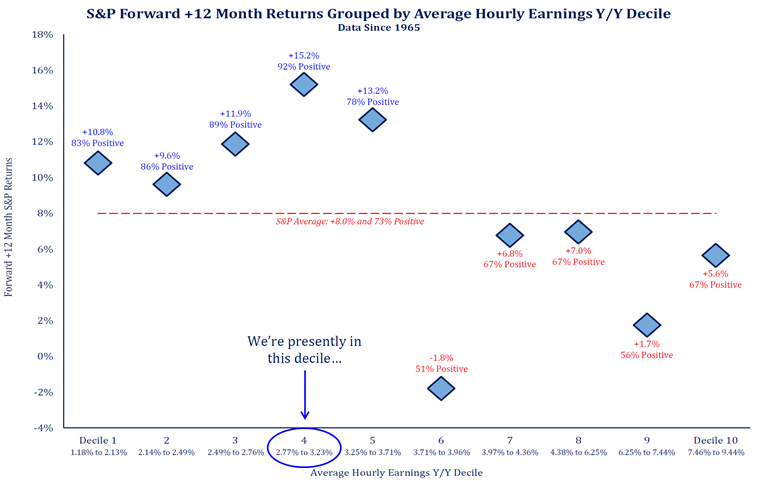
The quantitative analysis above illustrates the impact of rising wages on historical 12-month forward stock returns. As wage inflation crosses the +3.7% mark, wage growth becomes a net detractor to stock returns. The good news is that we remain far away from the 3.7% inflection point that historically hurt 12-month forward stock returns. In fact, the most recent employment data reported +2.8% wage growth, which places us in a historically advantaged position for 12-month forward stock returns. In a healthy economy, +2.8% wage growth has historically aligned with +15.2% forward returns for the S&P 500.
Despite the attractive and improving economic/quantitative backdrop for stocks, markets can from time to time become unstable after a short term run up in prices. Like a spring thunderstorm born of atmospheric instability, the run up in stock prices over a short period can lead to instability, resulting in a short but violent reset for stock prices. While scary, these short but violent bouts of volatility act as a clearing mechanism, restoring stability to the stock market and allowing investors to refocus on the factors that matter most, the long-term fundamentals.
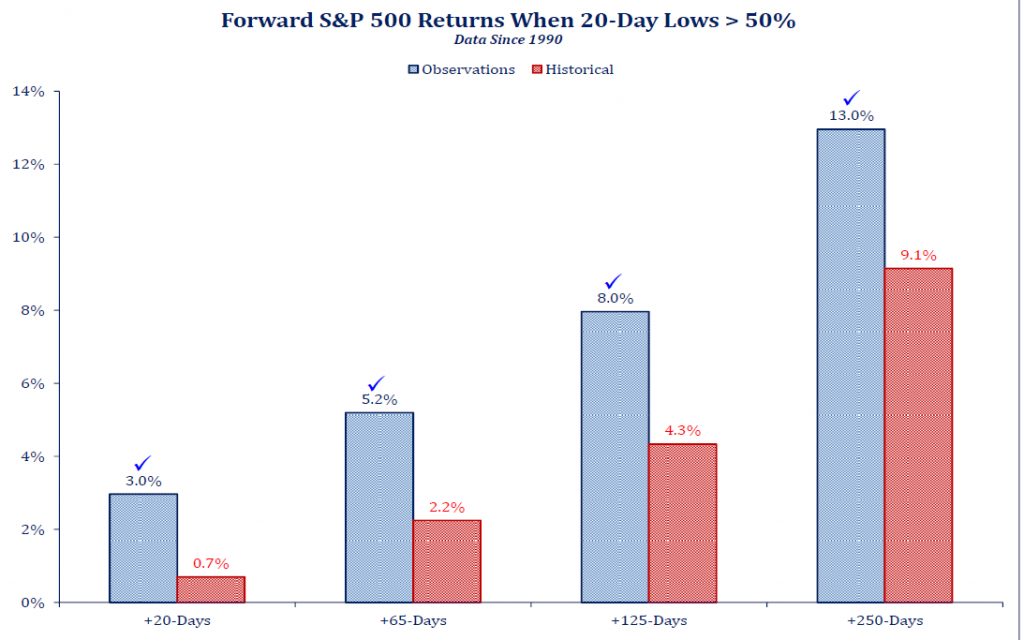
Price, valuation and underlying economic activity are the ultimate determinant of future asset returns. When we weigh the balance of evidence across the economy, credit markets, asset price/valuation, monetary policy and corporate earnings, the evidence indicates that stocks remain attractive relative to bonds, real estate and cash. In fact, when over 50% of the stocks on the S&P 500 hit 20-day trading lows, as is the case today, the forward returns for the stock market, 20, 65, 125 and 250 days are well above the historical norms as per the chart above.
The bottom line is that the LPAM Tactical Risk Indicators remain green, the economy remains strong, the financial system is healthy, and Americans are making more money in an environment where inflation remains contained. These factors, when observed in totality suggest to us that the recent bout of downward volatility in the market is like a spring thunderstorm, short, violent and scary but ultimately passing, leaving behind a fertile investment environment, well positioned to deliver attractive returns for investors over the next 12 months.
We want to thank all our advisor and client partners for your continued business and support. Your success is our success, so if you have any questions and/or concerns please do not hesitate to contact us and we will assist in any way possible. Thank you again and have a fantastic October.
The information presented here is not specific to any individual’s personal circumstances. These materials are provided for general information and educational purposes based upon publicly available information from sources believed to be reliable—we cannot assure the accuracy or completeness of these materials. The information in these materials may change at any time and without notice.
Investments involve risk and are not guaranteed. Actual performance of client portfolios may differ slightly due to various factors such as client deposits or withdrawals, investment guidelines and restrictions, or fees and expenses incurred by any specific individual portfolio, among other factors. S&P 500 is an unmanaged index of the shares of 500 widely held, predominantly large capitalization, U.S. exchange-listed common stocks. The index results neither include dividends reinvested nor reflect fees and expenses. Investors cannot invest in any index directly.
The discussion of any positions and/or recommendations discussed herein should not be assumed as an indication of future results. Due to various factors, including changing market conditions, such discussion may no longer be reflective of current position(s) and/or recommendation(s). Please remember that different types of investments involve varying degrees of risk, and there can be no assurance that any specific investment will be profitable or equal any historical performance.