LPAM Risk Factor: Green
As the cacophony of noise and fear emanating from today’s 24/7 media cycle grows louder by the day, never has it been more important to have access to an investment process that can remove noise and emotion from investing and position your portfolio based on the conditions on the ground, not on the words that appear the front page.
While tariffs and political instability have increased uncertainty and fear, the LPAM Risk Indicators have remained green throughout 2018 and remain green as we enter the back half of the summer. As a result, while headlines have driven many investors toward the safe harbors of cash and bonds, we have filled the void and used periods of volatility to acquire favored investments at discounted prices throughout the year.
The tables and charts below reflect the performance of our flagship investment strategies, which exited the market correction +39.05%, amounting +1173 basis points of outperformance after fees.
The decision to remain tactically positive during times of heightened investor anxiety positively contributed to performance. As of August 6, 2018, the flagship LPAM Tactical Opportunity strategy has advanced +13.71% return, after fees, in 2018 vs. +6.61% for the S&P 500 as the market has continued to climb the wall of worry throughout 2018.
Since inception (Jan 1st 2017), the LPAM Tactical Opportunity has delivered an after-fee return of +39.05% return vs. +27.32% for the S&P 500, outperforming the S&P 500 by 11.73%.
Moving forward, the LPAM Tactical Risk Indicators remain green. Employment growth remains robust across all sectors of the U.S. economy, manufacturing and industrial activity is expanding, and inventories are lean as we enter the back half of 2018. Additionally, U.S. businesses are benefitting from a material decrease in corporate taxation and a less onerous regulatory environment.
The friendlier tax and regulatory regime has lowered the cost of capital and led to higher returns on capital investments in the U.S. As a result, there has been a material increase in the level of corporate investment across the U.S. in 2018. The chart below illustrates the dramatic impact that lower tax and regulatory burdens are having on the propensity for U.S. business to reinvest capital vs. storing excess cash on corporate balance sheets or repurchasing company stock.
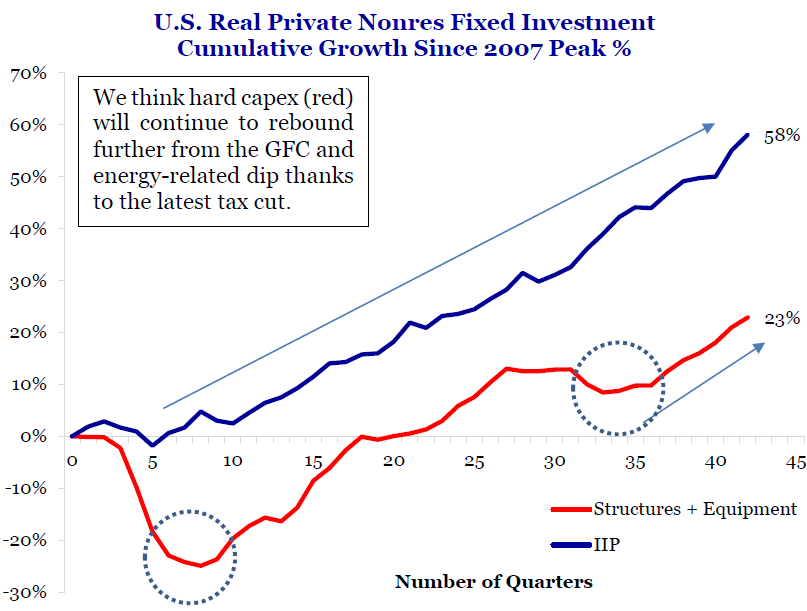
As capital flows into hard, labor intensive projects, the U.S. economy is positioned to benefit as the demand for labor will remain high and likely command marginally higher wages for U.S. workers as the supply of available workers decrease. These factors are taking place in an environment of moderate inflation, which should increase the level of foundational support for the U.S. economy in the short to medium term.
Regarding factors that present dangers to our positive outlook. The potential knock on effects of tariffs such as inflation and supply chain disruption are factors that we are keeping a close eye on. While tariffs certainly command attention in the press, its important to measure the size and scope of any potential economic drag caused by tariffs against offsetting policies that can potentially contribute to economic growth.
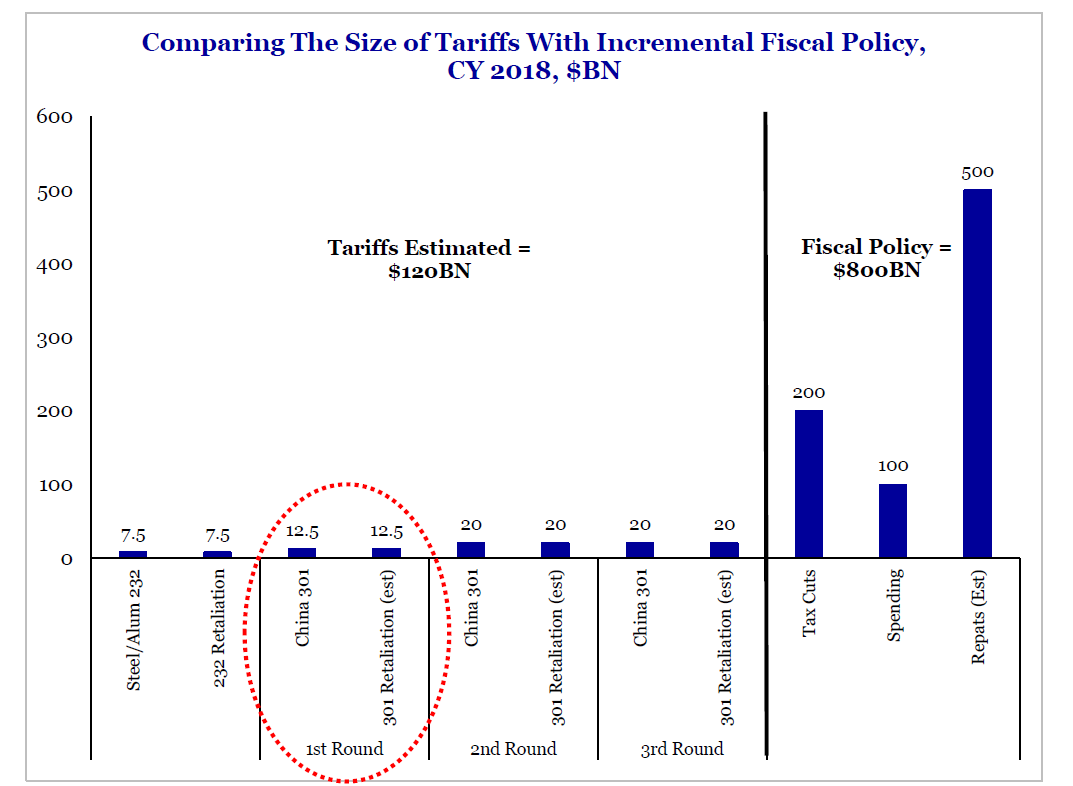
As the chart above illustrates, while $100 – $200 billion of tariffs makes for great front-page headlines, what is discussed less of in the press, is the $800 billion of cumulative fiscal stimulus entering the U.S. economy. Given the elevated level of demand for safe-haven assets such as bonds and gold, it’s clear to us that the current level of risk from tariffs appears overpriced while the benefits of the current economic stimulus is under appreciated by investors and the press alike. Given the data at hand, we are positioning client portfolios for economic surprises to the upside and investing in companies well positioned to benefit from a cyclical upswing in economic activity.
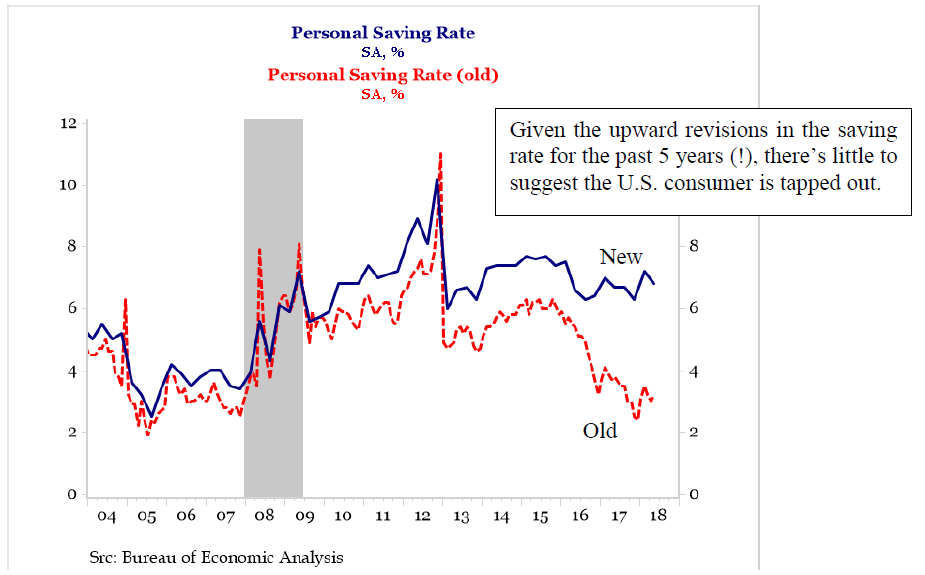
Additionally, one of the most important developments in July was the admission by the Bureau of Economic Analysis that it had been incorrectly measuring the level of savings that Americans had been accruing over the past few years. According to the New York Times, “The bureau had been overestimating the amount of national income held by corporations and underestimating how much of it was held by proprietors of businesses”. This means that people as opposed to corporations were sitting on that cash, resulting in an actual savings rate for 2017 of 6.7%, nearly double the prior estimate of 3.4%. As the chart below illustrates, Americans suddenly have much more spending power than previously thought. That’s great for the economy.
Meanwhile, we are cognizant that prolonged periods of above average economic growth can lead to overheating in the form of rising inflation. In an environment of 3-4% GDP growth and strong demand for labor, inflation is one factor, that if unleashed could force the Federal Reserve to tighten more quickly than our models currently anticipate, suppressing economic growth below our forecast. The LPAM Risk Indicators track various inflation inputs such as supply chain, labor and raw material costs. If these indicators rise beyond reasonable levels, we stand ready to act.
Fortunately, the pool of available labor appears to be stabilizing as previously disenfranchised Americans that had left the labor market, are re-entering the labor pool in droves, providing a stabilizing force to wages. As a result, inflation appears controlled and in the 1.5 – 2.5% sweet spot for both economic and corporate profit growth.
Regarding the sustainability of U.S. growth moving forward, the conditions appear to be in place for a sustained period of above average U.S. economic growth. In the long term, lower taxes and regulation have the potential to lift productivity growth in the U.S., which, if realized could lift the potential growth rate of the U.S. economy above 2% for the first time since the 1990’s.
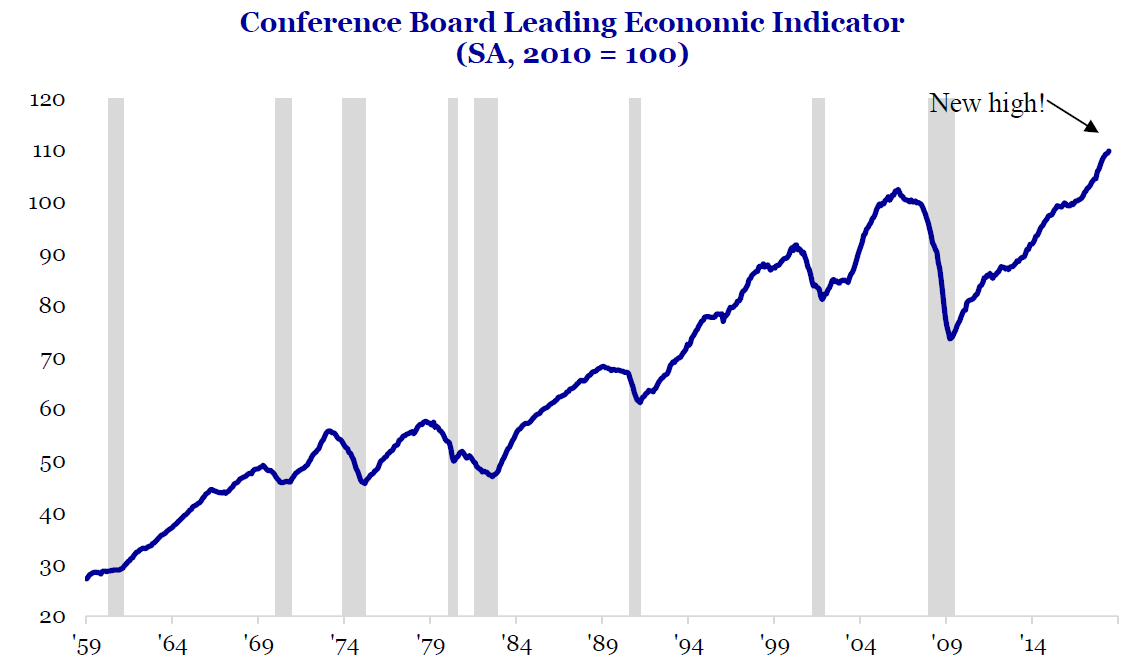
In the medium term, U.S. economic growth has momentum entering the second half of 2018. Personal consumption and fixed investments were the prime contributors to economic growth in Q2 while inventories represented a $27.9 billion drag on growth. With inventories at historically low levels, as companies enter the back half of the year, they will need to dramatically increase new orders to their channel suppliers to prepare for the holiday shopping season, which accounts for close 20% of total annual sales. If our forecasts are correct, this surge in new order activity should sustain economic activity at a high rate throughout the back half of 2018. The chart below shows the index of leading economic indicators, which include economic variables that tend to move before changes in the overall economy such as jobless claims, new orders and industrial production. The index recently hit a new high, which is atypical ahead of recessions.
To summarize, U.S. economic growth appears robust and well positioned for further gains in the back half of 2018 as companies restock inventory channels ahead of the holiday shopping season. With industrial activity leading the charge and monetary policy remaining accommodative relative to the current level of economic growth, our work suggests that the stock market is positioned to climb the proverbial wall of worry in the back half of 2018.
As a result, we are positioning client portfolios in areas of the market that historically outperform during times of sustained economic activity. We are specifically focusing our investment firepower on companies that are positioned in areas of the economy that our research indicates are poised to benefit from more persistent long-term growth such as cloud computing & artificial intelligence, digitization of everything along with personalized medicine and consumer brands that cater to experiences and command a robust e-commerce supply chain infrastructure.
Client portfolio remain overweight technology, consumer discretionary and financials. Over the course of the past month, we have reduced our exposure to internationally exposed industrial stocks such as Caterpillar, which may face a prolonged period of investor antipathy as investors wait out the back and forth of global trade negotiations. Our exposure to utilities, consumer staples and REITS remains zero as we view these traditionally defensive areas of the market as the most expensive based on our growth adjusted valuation metrics and are poorly positioned to benefit from key long-term growth themes in the economy.
These investments are only made if our overall market indicators are green. If our indicators turn cautious we will move to the sidelines and raise cash.
The bottom line is that for investors equipped with the correct tools to separate fact from fiction, even years such as this one where fear pervades every corner of the market, can offer a path forward to advancing your annual financial objectives. The key is having a tested investment process that is data driven and can look past the headlines and act when the data on the ground determines that action is required.
As per usual, we want to thank all our advisor and client partners for your continued business and support. Your success is our success, so if you have any questions and/or concerns please do not hesitate to contact us and we will assist in any way possible. Thanks again and have a fantastic August.