Amidst the panic over trade wars, inflation and war that afflicted markets in Q1, having an investment process that can discard the noise of the 24/7 media cycle and focus on the data that matters remains paramount.
As volatility increased in Q1, the data driven LPAM Tactical Risk indicators were a steady green, as the underlying data that drive market returns continued to improve despite news headlines suggesting otherwise. As a result, we used the 10% drawdown in the S&P 500 to increase exposure in companies that command disruptive and dominant leadership in areas of the economy positioned to benefit from multiple sources of sustainable, long term growth.
The tables and charts below reflect the performance of our flagship investment strategies, which exited the market correction +33.73%, amounting +990 basis points of outperformance after fees.
The decision to put client money to work as stocks headed lower, positioned client portfolios to benefit from the ensuing rebound in the market that was led by technology and consumer discretionary stocks, our two key overweight equity market exposures. These factors were positive contributors to performance while our industrials weight was a drag on performance due to the effects of a strong U.S. dollar on exports.
Going forward, the LPAM Tactical Risk Indicators remain green, which means that client portfolios remain on offense.
While trade and monetary policy remain potential risks to future asset returns, the positive tailwinds emanating from corporate America, the U.S. labor market, long term interest rates, deregulation and a strong global economy, remain strong enough to overcome these risks and position asset prices to move higher in the short to medium term.
When considering the potential path of future asset prices, the LPAM investment process considers three key inputs;
- Interest and credit markets
- Macro-economic environment
- Corporate earnings cycle
The movement of stock/asset prices that we see daily in the media is the result of many moving parts under the surface. Prior to selecting the actual businesses that we invest in, it’s important to determine the stability of the foundation, which stocks and bonds rest upon. Healthy foundations are generally built on healthy banking systems, supportive interest rate environments and an economy characterized by healthy growth. The good news is that our indicators point to a stable and strong foundation, allowing us to focus on sectors and companies that are positioned to benefit in today’s digital marketplace.
Surprise – Interest Rates Remain an Asset
While monetary policy has tightened over the past two years and the 10-year yield has risen from a nadir of 1.5% to 3.0% this past May, the cost of capital relative to the growth rate offered by investable assets remains at a historically attractive spread. In the real world this means that interest rates have increased by around 1%, but corporate earnings growth has increased faster than the cost of capital required to fund investments, leading to a more attractive return on invested capital.
Additionally, the banking system remains over capitalized and corporate balance sheets are flushed with cash. We see this playing out within our risk models as corporate credit costs remain near record lows, while lending activity across the banks has increased thanks to a renewed wave of deregulation sweeping through the financial sector. To summarize, banks are healthy, credit is cheap, the lending arteries are clear, and businesses are borrowing to expand.
Help Wanted – Labor Market is STRONG
On the economic front, the data remains favorable and strong. The U.S. labor market has generated close to 1.037 million jobs year to date, or an average of 207,000 per month, with growth accelerating in May, as non-farm payrolls increased by 223,000, an increase from the March/April two month average of 157,000.
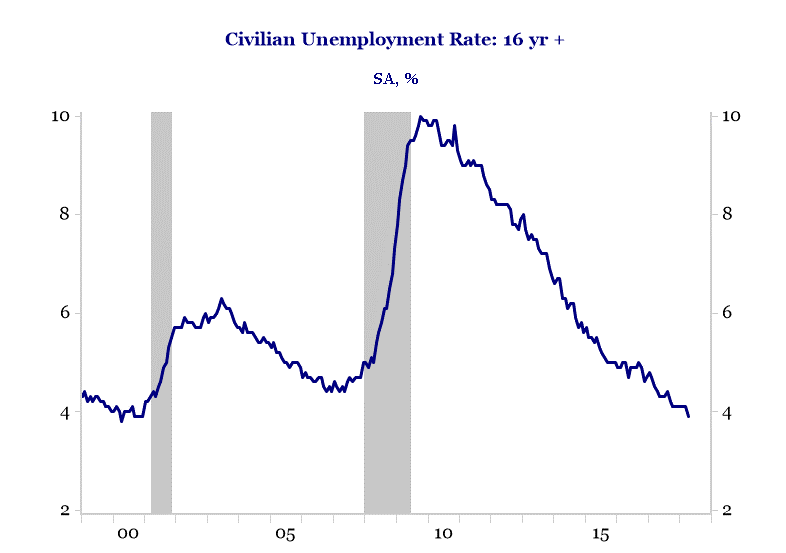
The continued run of strong employment growth has led to sustained decline in the supply of available workers across the U.S. The healthy decline in labor supply has had the positive effect of lifting wage growth beyond 2.5% year over year growth and expanded the labor pool to previously disenfranchised workers that had criminal records or poor credit history. A rising tide that lifts the boat for all Americans is a positive contributor to the potential long-term growth rate of the U.S.
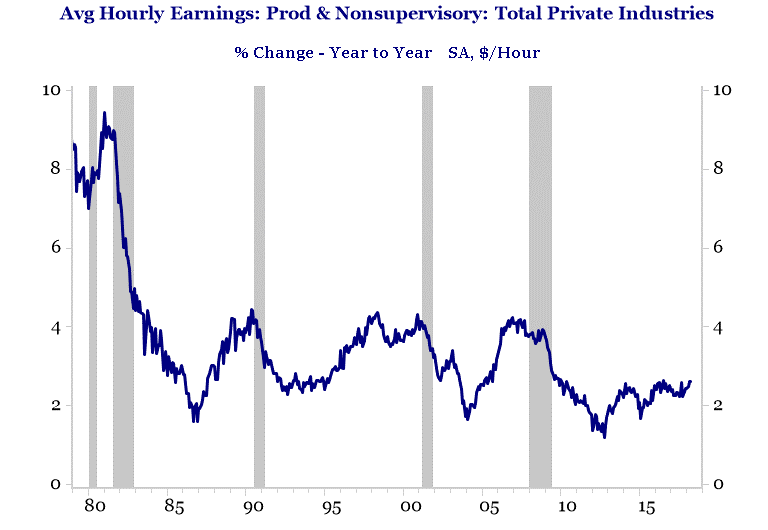
Fortunately, the rise in wages appears controlled as the long term unemployed, which had previously left the workforce, are re-entering the workforce, providing a moderating force on wage inflation that would otherwise force the Federal Reserve to increase interest rates more aggressively.
The American Manufacturing Renaissance
On the manufacturing front, U.S. activity continues to accelerate with industrial production growing 3.5% and the ISM indicator of manufacturing activity rising to 58.7 (50 marks expansion) in the month of May. While manufacturing only makes up around 12.5% of total U.S. GDP and 8.8% of U.S. employment, corporate earnings growth has a high degree of sensitivity to changes in manufacturing activity. This high degree of sensitivity means that symptoms of economic weakness and/or strength that would otherwise go undetected, come into focus when analyzing industrial activity.
Perhaps more importantly, the continued advancement of economic activity appears to be sustainable. When determining the sustainability of economic growth, we pay special attention to the level of inventories across the U.S. relative to the rate of new orders, otherwise known as the inventory cycle.
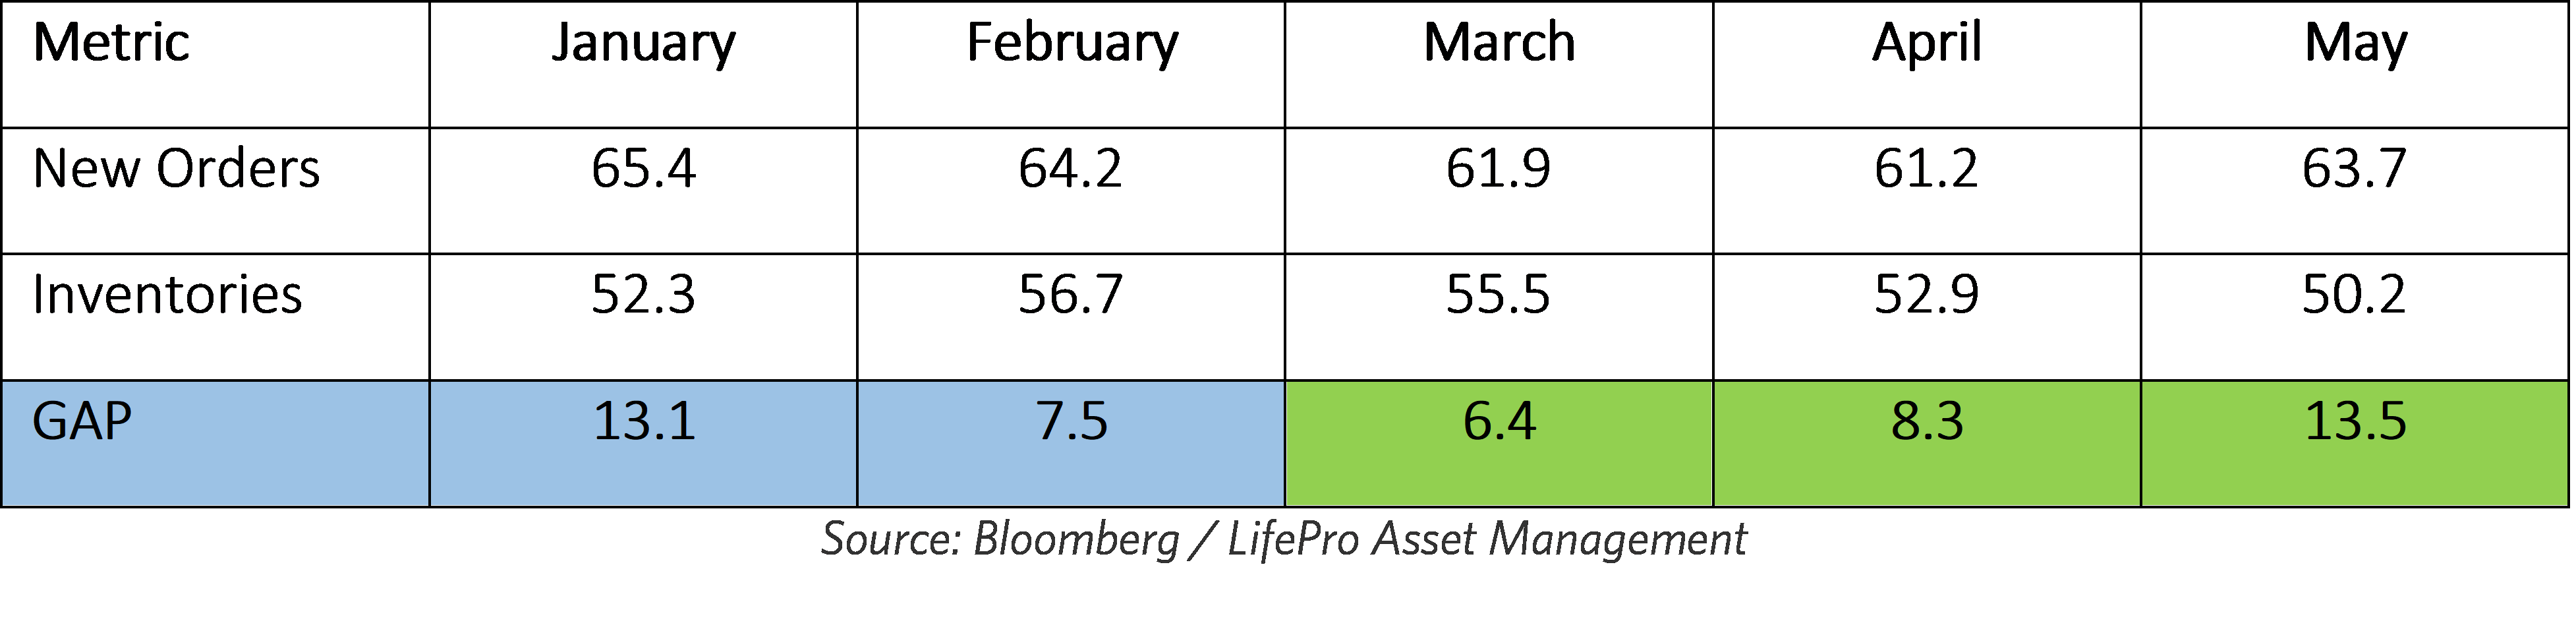
When determining whether growth is sustainable for companies or the economy, we want to ensure that growth is not being front end loaded because companies are ordering more product relative to the anticipated sell through rate. The table above, populated by our risk models, tracks this activity by measuring the growth in new orders and inventories across the U.S.
Despite entering the 10th year of economic expansion, not only are new orders growing stronger than inventories but the output gap between the two indicators is rising. This means that despite strong order growth, inventories remain lean and will likely need to be replenished in the future. In summary, the current level of economic growth appears sustainable for the time being, providing a strong level of foundational support for asset prices.
Earnings Are Strong and Prices Are Reasonable
Regardless of whether we look at corporate earnings with the positive effect of recent tax cuts or adjust for those tax cuts, earnings growth is expected to remain strong. After the Federal Government passed tax cuts in late December, economists had forecasted earnings to rise 17% in Q1. Despite the elevated expectations, the overall growth rate came in closer to 22%.
For investors, this means the recent stock market correction made stocks 10% cheaper in price despite an upward adjustment to the future slope of expected earnings growth. In the past thirty years, we found two instances of a range bound stock market while earnings and economic growth were strong. These two instances occurred in 1984 and 1994. In both cases, these breather years were followed by strong stock market performances (+26% in 1985 and +35% in 1995) in the following year.
While the second derivative of earnings growth is expected to slow in 2019, if the state of inventories remains lean and new orders remain strong, the economic backdrop would be in place for stocks to move higher in 2019. Given that many variables are still at play between now and then, we remain prudent and will let the actual data be the ultimate guide to our asset allocation decisions across client portfolios.
Positioned for Long Term Growth
Client portfolios remain overweight technology, consumer discretionary, industrials and banks. Our exposure to utilities, staples, REITS and energy remains zero percent. Portfolio construction remains focused on being invested in what our work suggests are the leading areas of secular growth while using the balance of our cash to purchase bank and industrial stocks to take advantage of the anticipated upswing in cyclical growth.
When positioning client portfolios, we want to invest in companies that are either leading disruptive change against established areas of the economy (Amazon/Retail) and/or companies that are emerging growth leaders in new markets that did not previously exist (Illumina/Genomic sequencing). Our favorite areas of long term secular growth remain the digitization of everything, artificial intelligence, industrial and medical automation, genomic sequencing and over the top media offerings such as Netflix and Spotify.
These investments are only made if our overall market indicators are green. If our indicators turn cautious we will move to the sidelines and raise cash.
We want to say thank you to all our advisor and client partners for your continued business and support. Your success is our success, so if you have any questions and/or concerns please do not hesitate to contact us and we will assist in any way possible. Thanks again, and have a fantastic June.