After a volatile first quarter, a series of short term indicators we track are pointing to an exhaustion of selling that fueled the bull market correction that began in February.
While short term indicators don’t affect our asset allocation decisions, they do increase the level of confidence in our longer-term LPAM risk indicators, which point to a favorable environment for stocks in Q2.
The number of positive data divergences that began to take shape across the stock market last week, expanded, despite the stock market revisiting its February lows. When the breadth and scope of so many indicators diverge at the same time from the broader market, it materially increases our level of conviction that recent short term selling pressure has exhausted itself.
Bottom line: The LPAM Risk Models indicate that we are in the ninth inning of this bull market correction. As a result, we are not raising cash and are using weakness in the market to opportunistically purchase shares in favored companies that are attractively priced, post the selloff.
LPAM Q1 Performance Update
Given the volatility of the past month, we felt that it would be beneficial to look back at what happened in the stock market over the past month, explain why it happened and how the LPAM Risk Management process deals with such events. Lastly, we will discuss what our LPAM risk indicators are suggesting will happen next.
When managing a tactical investment strategy, it’s important to determine when it makes sense to be tactically patient vs. tactically active, regarding client market exposure and individual investment decisions. The most common mistake that tactical money managers can make is that they make investment decisions based on noise (news headlines) and stray from a disciplined investment process grounded in data.
The LPAM decision to increase or decrease exposure to the stock/bond market is based on the following question;
Are we entering a bull market correction or are we experiencing an end of cycle stock market correction, which requires tactical intervention?
The LPAM risk models track a series of fundamental and quantitative indicators that measure the health of the market and based on the balance of evidence at hand, direct us to be tactically patient and do nothing or tactically defensive, requiring us to reduce market exposure in client portfolios ahead of a potential downturn.
Over the past month, our LPAM Risk Indicators have remained green, which indicates to us that we are experiencing a classical bull market correction. It should be noted that the S&P 500 on average, experiences at least one 10% drawdown every year. Last year was a historical aberration, with no pullbacks in the market of greater than 5% taking place.
When our risk indicators determine that we are entering a bull market correction, we decide to be tactically patient. The reason for this is that bull market corrections are extremely hard to time since they are violent and short term in duration. Attempting to time and trade around a bull market correction often leads to a drag on long term performance figures.
Our focus is to avoid dangerous bear market cycles. When the LPAM Risk indicators determine that we are entering the end of the bull market cycle, regardless of our level of single stock conviction, we will sell stocks and raise cash across the board.
What is a Bull Market Correction and How is it Different Than an End of Cycle Correction?
A bull market correction is a short term, violent drawdown in the stock market of at least 10% that takes place in an environment of improving economic and corporate health. The stock market typically enters a bull market condition exhibiting strong internal health. In other words, most stocks are participating in the rally with stocks that benefit the most from strong economic growth leading the charge.
Economically, bull market corrections take place in an environment where employment is growing, industrial production is strong, inventories are lean, and inflation is under control. On the micro side, corporate earnings tend to be strong, powered by strong revenue growth and accompanied by margin expansion.
Why Do We Have Bull Market Corrections?
Bull market corrections can occur for several reasons but often precede a period of strong upward price momentum for the stock market, accompanied by unusually low volatility.
A stock market that exhibits low volatility and has appreciated strongly over a short time period, is equivalent to a track and field sprinter that has just sprinted for 200 meters. That runner will still make it around the track but to do so, he/she needs to catch their breath. Bull market corrections allow the stock market to catch its breath to complete the bull market journey.
What is an End of Cycle Correction?
End of cycle corrections are generally the first step toward the slow and gradual death of the existing bull market and acts as a transition phase to a prolonged bear market. Bear markets are born through a gradual long-term deterioration in the underlying fundamentals that drive bull markets and are characterized by drawdowns of greater than 20%.
Unlike a bull market correction, end of cycle corrections shares little in common with a healthy sprinter. A dying bull market is like a patient with many chronic health conditions. You may in fact not notice the deterioration much at first but over time, the number of negative factors expand and deepen, eventually overcoming the patient.
The good news is that end of cycle corrections tends to be gradual, giving investors that are equipped with the right tools to identify the symptoms of a dying bull market, time to prudently position client portfolios ahead of the downturn.
What Type of Correction Are We in Today?
The LPAM Risk Models indicate that we are working our way through the end stages of a bull market correction. Entering the recent correction, corporate earnings were and continue to be strong and improving, the labor market is strong, generating 200,000+ jobs per month, economically sensitive stocks were outperforming stocks that outperform during recessions and inflation was low.
Despite the continuation of good news, the strong run up in stocks, in the backdrop of low volatility at the beginning of January left stocks exposed to headline risk. Bull market corrections are often said to ambush investors with a smack and then fade into the shadows just as fear has reached its peak, with the current bull market correction being no exception.
The current bull market correction was ignited when the exceptionally strong January jobs report gave rise to interest rate and inflation fears, that investors had previously not priced into their risk models. That fear was compounded when the Trump administration announced tariffs on steel and later, China.
Fortunately, our data driven LPAM Risk Indicators, as noted above, stayed green, which simply means that the underlying fundamentals that have supported the bull market haven’t changed. As a result, our firm followed our indicators and made the call to be “tactically patient” and accumulate shares in our favorite companies at heavily discounted prices relative to their intrinsic value. This was a positive contributor to performance in the first quarter.
What Increases Our Confidence Level That the Correction is Over?
Since bull market corrections often lack a fundamental driven price move, the two biggest factors that drive bull market corrections are PRICE & TIME. Both factors are critical in removing short term froth that accumulates from a strong move upward in price over a short time period. When assessing whether a bull market correction is near its end, we track the following indicators;
- Time & price
- Investor sentiment & volatility
- Decreased participation
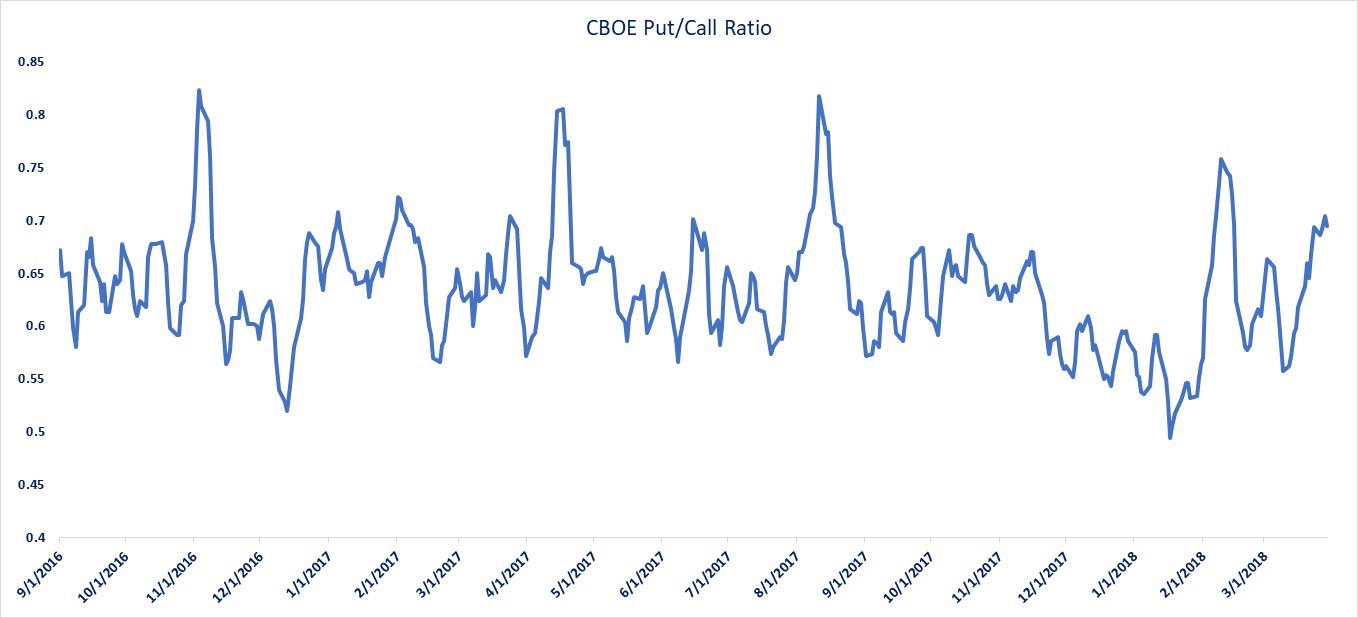
As the selloff entered its second wave in mid-March, an interesting divergence occurred. While the market revisited its lows, the level of protection buying did not. This was the second piece of evidence in our back pocket to suggest that the bull market correction was exhausting itself.
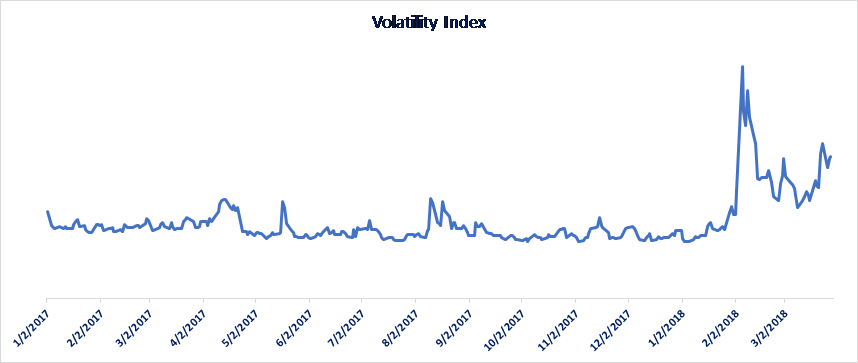
A similar picture unfolded with the VIX, which measures the level of perceived volatility in the market. The VIX surged to 37 in the first wave selling, but only reached 22 when the S&P 500 revisited its lows in March. Evidence that fear was beginning to exhaust itself under the surface.
Decreased participation – A true bull market correction starts with a thud and fades over time. Bull market corrections catch most investors off guard, so the initial reaction tends to be violent and involves across the board selling. The initial selloff in February was the most violent part of the recent correction as illustrated by the chart below. During the initial phase of the selloff, there was nowhere to hide, with close to 80% of stocks on the S&P 500 hitting 20-day lows in price.
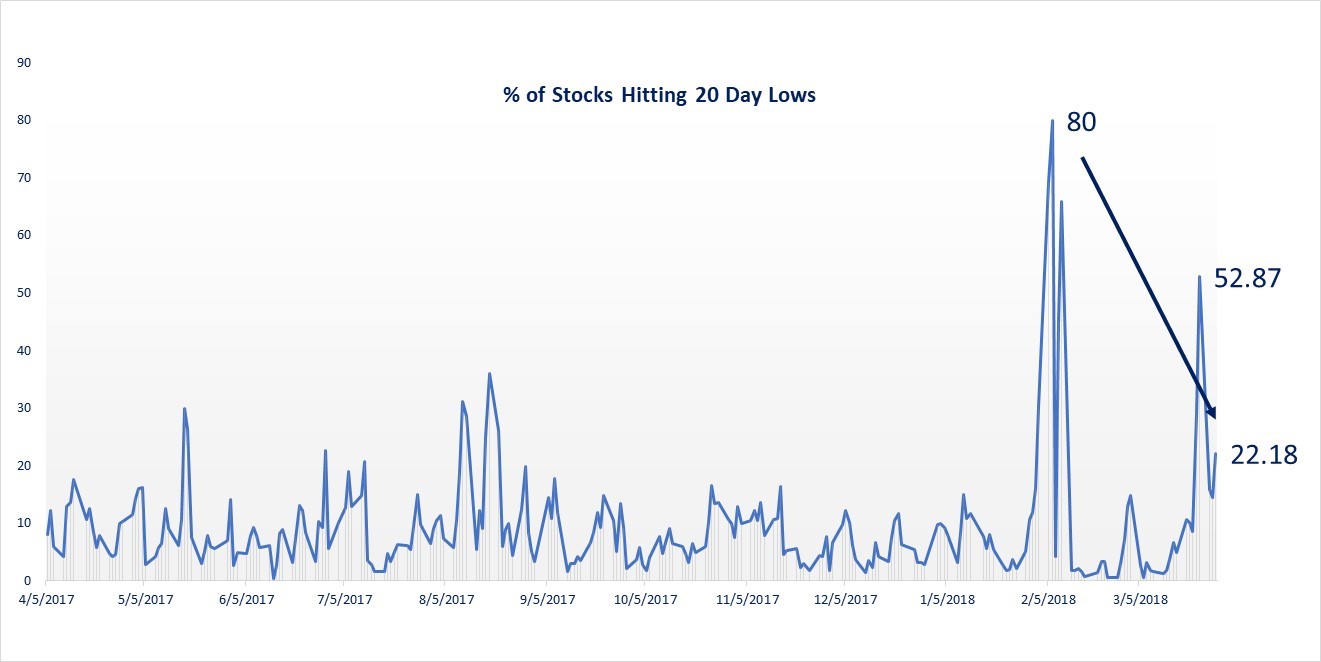
After news of the China tariffs, we experienced a second wave of selling hit the market, followed by a third wave of selling in technology stocks, initiated by the data leak scandal at Facebook. Notice however, how each wave of selling in the market was accompanied by fewer and fewer stocks participating in the selloff. By the time that headline selling reached its crescendo earlier this week, only 22% of stocks were hitting 20-day lows.
This behavior is typical for bull marker corrections. While the selloff may seem sustained on the surface of the market, under the surface, the market is taking its turn to hit each area of the market, starting with the worst performing stocks first and ending with the best performing stocks last. By the time the correction reaches the market leaders, the selling has exhausted itself across most of the market.
That’s why when we measured the balance of evidence across our indicators and saw Amazon selloff 7% on an immaterial headline regarding Trump and sales taxes, it was clear that the correction had finally reached its last victim.
The balance of evidence is clear to us. The short-term trading indicators suggest that the bull market correction has exhausted itself in a market environment where the long term LPAM indicators remain green. Exhaustive selling combined with a strong and healthy macro-economic environment, points to a healthy environment for stocks as we enter Q2.
Thank you to all our advisor and client partners for your continued business and if you have any questions and/or concerns please do not hesitate to contact us.